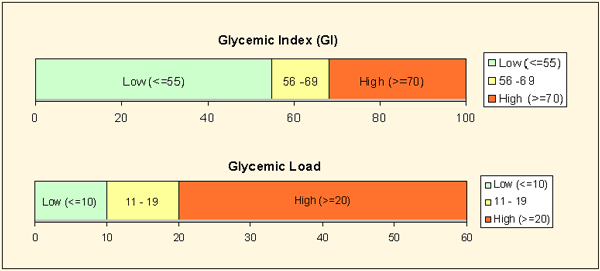
The Glycemic index is a way of measuring a foods carbohydrate effect on a person’s blood sugar levels, or “blood glucose levels”. As you might be aware, spikes in your blood sugar level cause cravings.
The long and short of it is that a healthier diet consists of foods that fall in the lower range of the index, generally under 55. Foods that fall in the high range (70 and up) are risky. Complex carbohydrates low on the index can even raise your metabolism and help you lose weight more quickly.
The following are just a few to get you started:
Sugars
Fructose – 12-25, average 19
Glucose – 85-111, average 100
Honey – 32-87, average 55
Lactose – 46
Diary products
Milk, regular (full fat) 11-40, average 27
Skimmed milk – 32
Yogurt without sugar – 14-23
Bread
White bread – 64-87, average 70
Whole wheat bread made with whole wheat flour – 52-87, average 71
Muffins, cakes, pancakes, waffles etc – vary between 38-102, mostly between 55 and 80
Crackers
Rice Cakes – 61-91, average 78
High fiber rye crispbread – 59-69, average 64
Cold Cereal
All bran – 30-51, average 42
Bran buds – 58
Corn flakes 72-92, average -81
Corn Chex – 83
Fruit loops – 69
Rice chex – 89
Special K – 54-84
Hot cereal
Quick cooking oats – 66
Instant cream of wheat – 74
Grains
Barley – 22-48
Barley, cooked – 50
cornmeal boiled in water – 69
long grained white rice – 50-64
Short and medium grained white rice – 83-93
Brown rice – 66-87
Pasta
Rice pasta – 40-92
Mung bean noodles – 26-39
Fruit
Apples – 28-44, average 38
Raw apricots – 57
Dried apricots – 31
Underripe Banana – 30
Overripe Banana – 52
Cherries – 22
Dates – 103
Grapefruit – 25
Grapes – 46-49
Pears – 33-42
Plums – 24-53
Strawberries – 40
Fruit juice
Carrot juice – 43
Cranberry juice cocktail – 52-68
Grapefruit juice – 48
Orange Juice – 46-53
Pineapple juice – 46
Tomato Juice – 38
Vegetables
Beets – 64
Carrots – 16-92 average 47
Corn – 37-62, average 53
Potato – 56-111
Sweet potato – 44-78
Legumes
Blackeyed peas – 33-50
Chick peas (garbanzo beans) – 31-36
Chick peas, canned – 42
Canned kidney beans – 52
Lentils – 18-37
Canned lentils – 52
Dried split peas – 32
Pinto beans – 39
Soy beans – 15-20
Nuts and snacks
Cashews – 22
Corn chips – 72
Peanuts – 7-23
Popcorn – 55-89
potato chips – 51-57
Candy
Jelly beans – 76-80
Life savers – 70
skittles – 70
snickers – average 55
Read more: http://www.righthealth.com/topic/Food_List_Glycemic_Index#ixzz1QMyylbZ9
Read more: http://www.righthealth.com/topic/Food_List_Glycemic_Index#ixzz1QMxaOKhy


5 comments
[…] to stuff your self to the gills. You do that by not eating sugar or carbohydrates high on the GI scale. Remember, sugar begets more sugar. Yes, you do need carbs, but make sure they are complex […]
[…] evaluating carbs, look at both the fiber content — it should be high — and glycemic index, which should be low, says Dr. Walter Willett of the Harvard School of Public […]
[…] The Glycemic Index and Load […]
[…] difference being 5 and 10 is the difference between complex and simple carbohydrates (remember the Glycemic Index?) It takes us less calories to break down fat in our body. But look at protein. The body […]
[…] cheese is very low on the Glycemic index. It has a load factor of 1 on a scale of 0 to 250, which means that it releases its energy into […]